Base build

Base build testingLB500LB600LB700ACLB 200Standard or solid-state switching

End-of-line

End-of-line testingLCLB 160LCLB 240ACLB 60

Applications

Cooling

Chillers and cooling plantStatic and dynamic load testing

Power

UPS systemsGeneratorsSwitchgear and power qualityProtection settings

Explained

Liquid coolingGPU load testingWater qualityLoop monitoringCommissioning

Equipment

Commissioning equipment

Manifold trolleyFlushing & refill cart

Tools

The full rangeSizing calculatorDatasheets

Services

Commissioning supportLoad bank hireHigh load simulationBespoke load banksSupply and installationMaintenance and repairDeployment and managementBuy or hireProjects

Company

AboutPartnersProjectsAcademyNewsEventsFAQ Speak to the team
Home/Explained/Visibility inside the loop
Explained

How to see what every cooling loop is actually doing

Five explainers on manifolds, fluid distribution and measuring circuit by circuit.

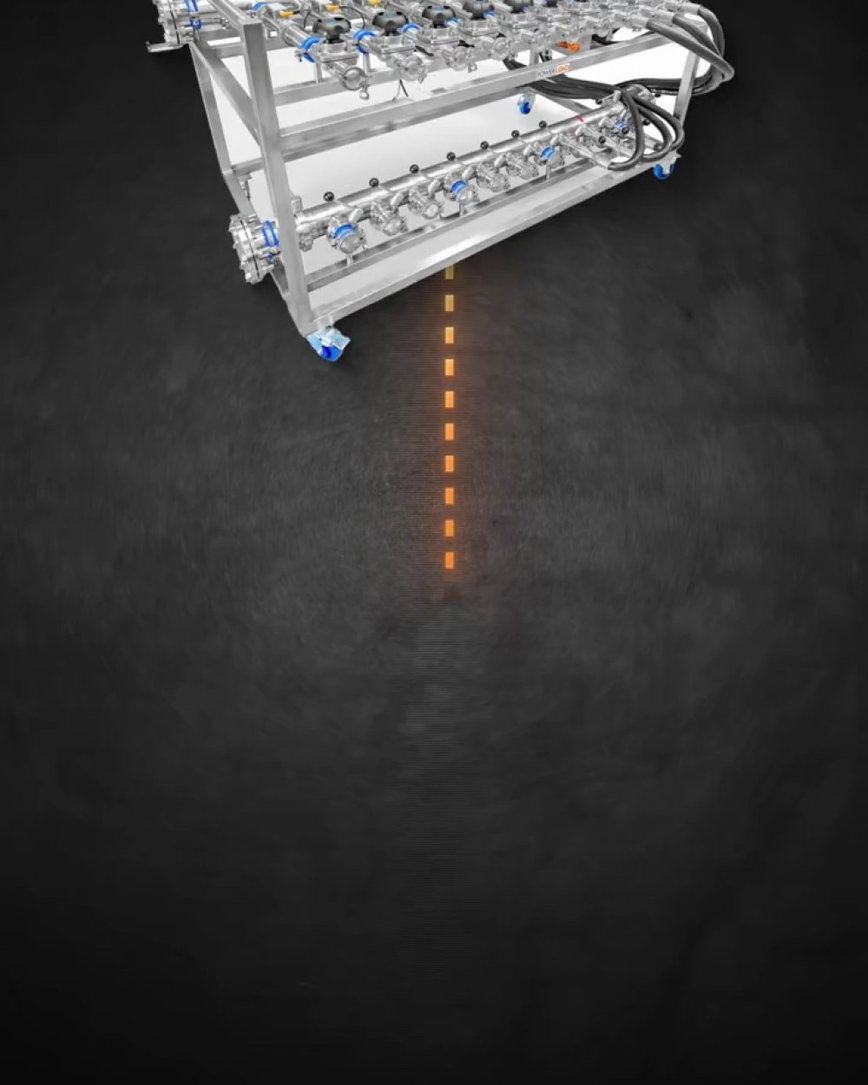
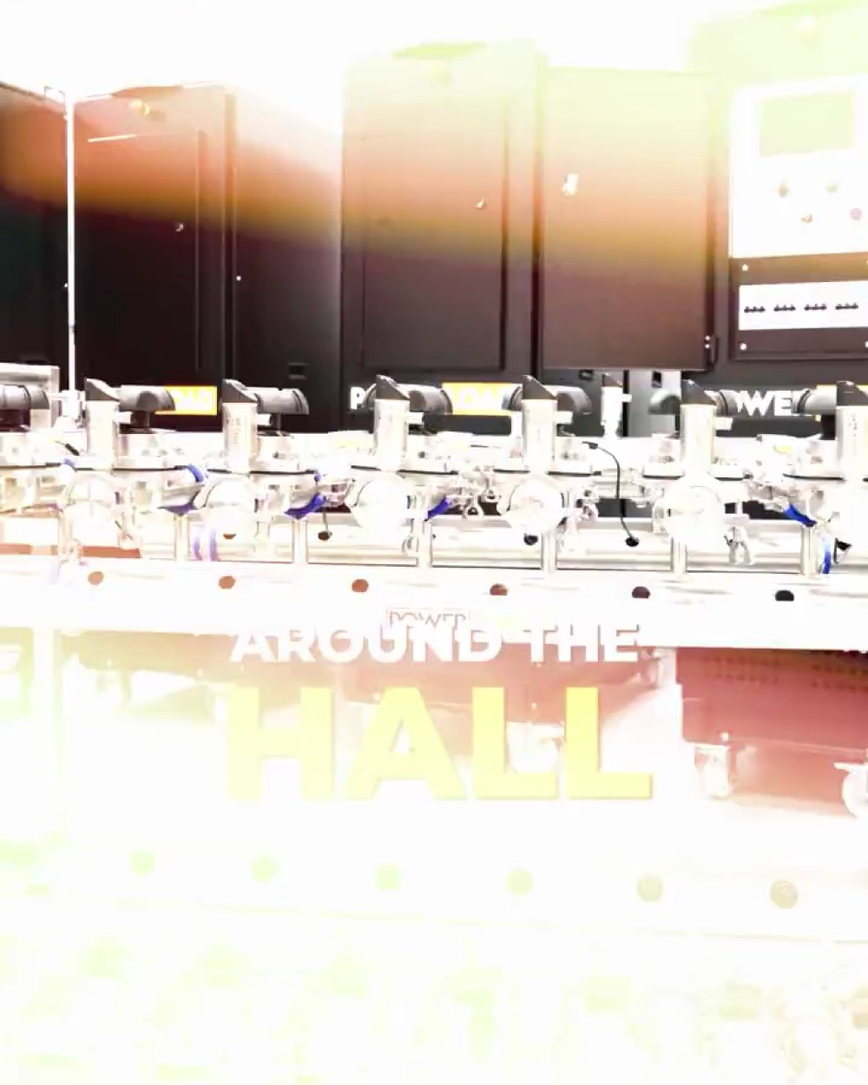
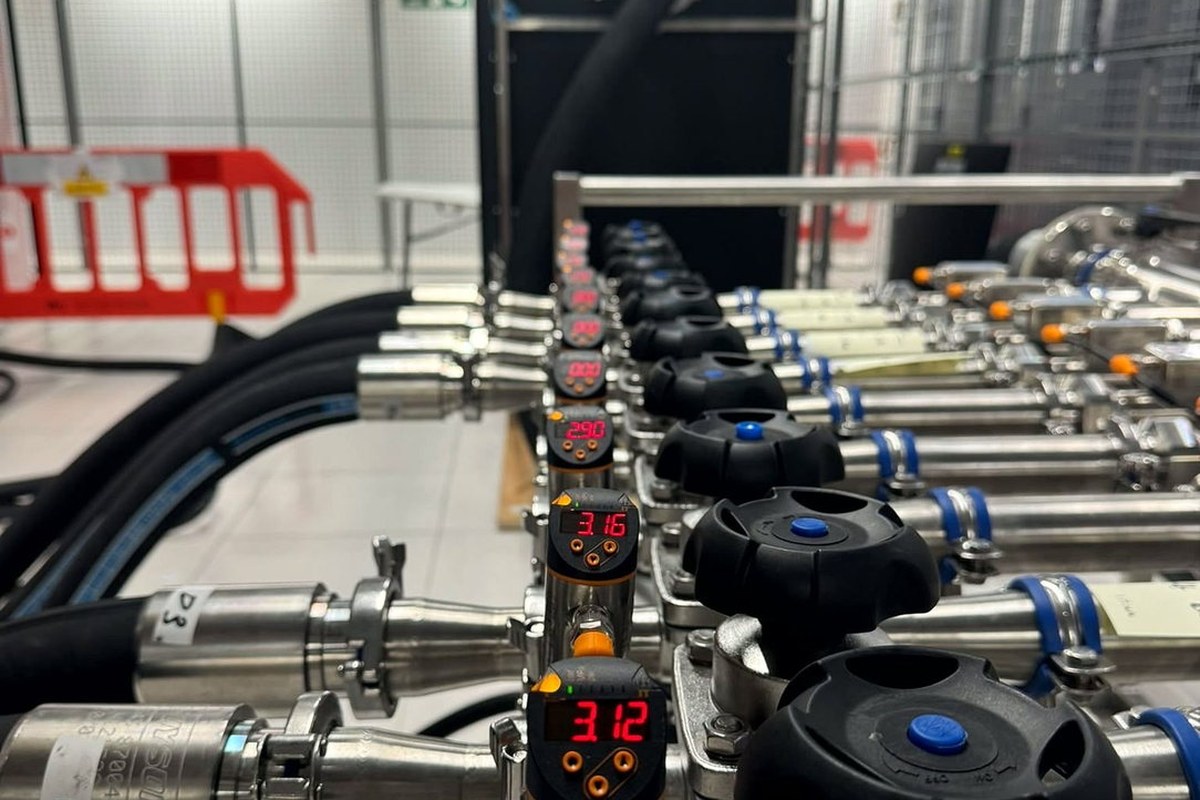
A PowerLoad commissioning manifold trolley in a data hall
EachOutlet metered on its own
LiveFlow, temperature, pressure
Per loopNot per system average
OnePoint of control

Measuring flow and temperature at the supply and return tells you the average, and an average hides a single circuit that is quietly underperforming. A commissioning manifold splits the supply into individually monitored loops and reports flow, temperature and pressure on each one, so a weak loop shows up during commissioning rather than as a throttling rack months later.

What an average hides

A hall can look healthy while one loop runs short

Whole-system instrumentation answers the wrong question. It tells you what went in and what came back, so the aggregate reads correctly while a single circuit quietly underperforms.

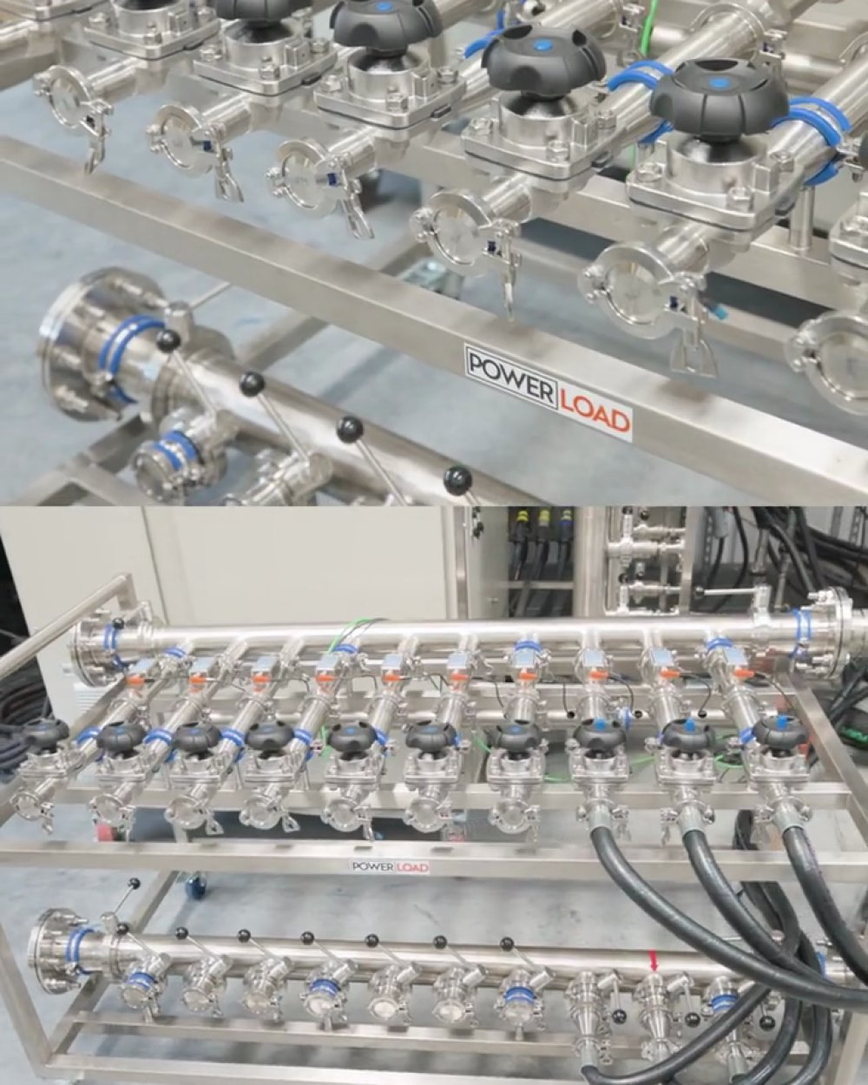
  • 1 to 2 inch hose pairs, each independently metered and controlled
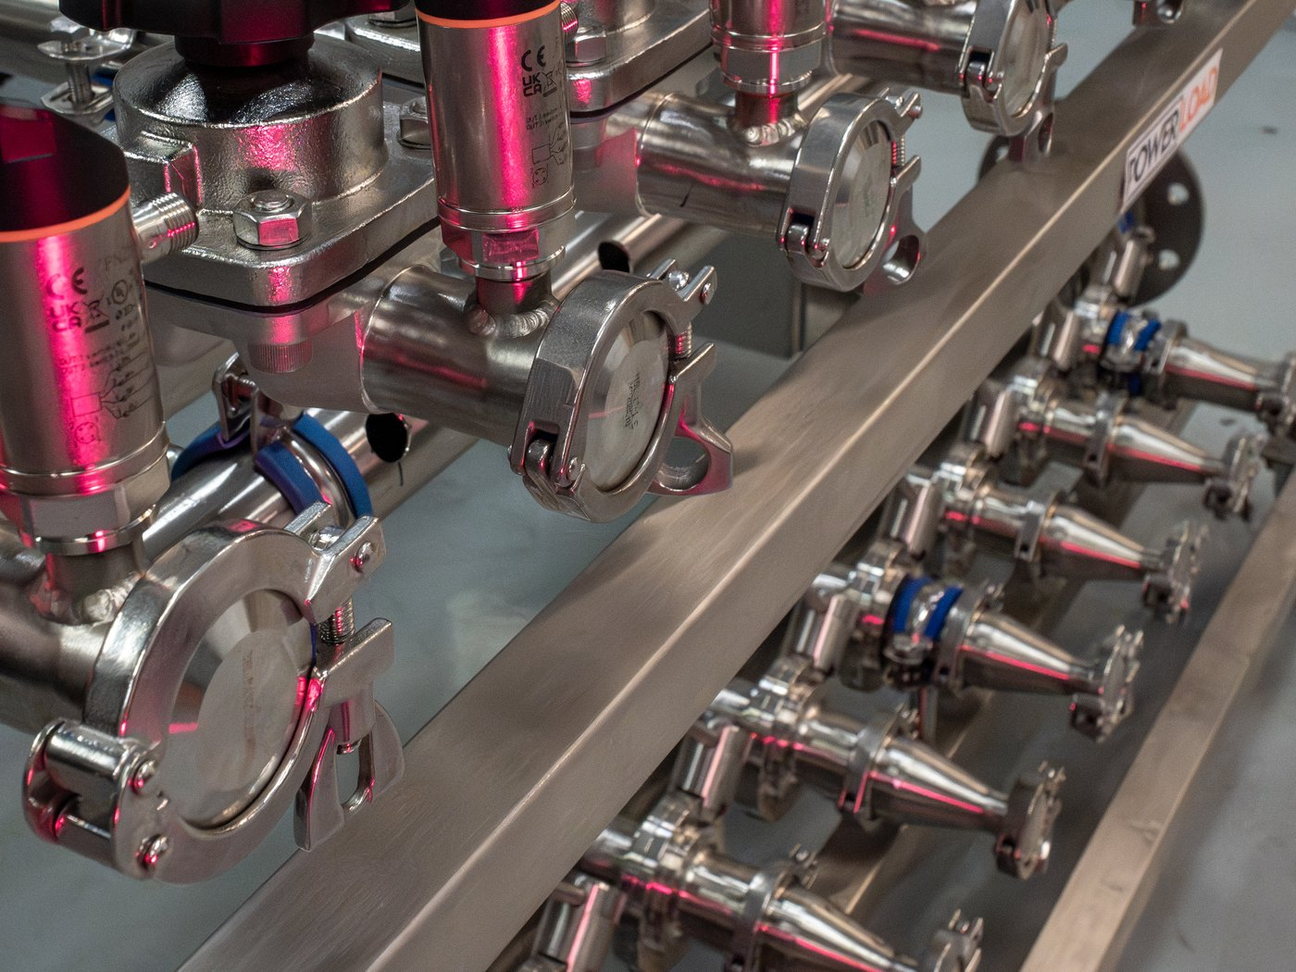
  • Every circuit gets its own isolation valve, flow metering and quick-connect fittings
  • Each outlet reports real-time flow rate and temperature back to the controller
  • A target pressure drop can be set on each valve
  • Circuits can be configured or rebalanced without shutting the whole setup down
  • Testing circuits together is what reveals starvation and imbalance between them
Close view of a PowerLoad instrumented commissioning manifold
Why loop by loop

Every circuit measured, not the system average

Splitting the distribution into separately monitored circuits changes what you are able to prove. Instead of showing that the system is fine on average, you can show that every loop that will feed a rack is delivering what that rack needs, and identify exactly which one is not.

  • Flow, temperature and pressure across every hose, in real time
  • A weak loop shows up during commissioning rather than as a throttling rack months later
  • Data feeds back live, so a creeping temperature is caught while the team is still on site
  • Balancing happens in one place rather than being spread manually around the hall
Manifold trolleys
Watch and read

Five explainers on manifolds and loop-level measurement

Manifolds, fluid distribution points and what changes when you measure circuit by circuit instead of at the supply and return.

FAQ

Visibility inside the loop, answered

Flow, temperature and pressure across every hose, in real time, so each circuit can be assessed individually rather than as part of a system average.
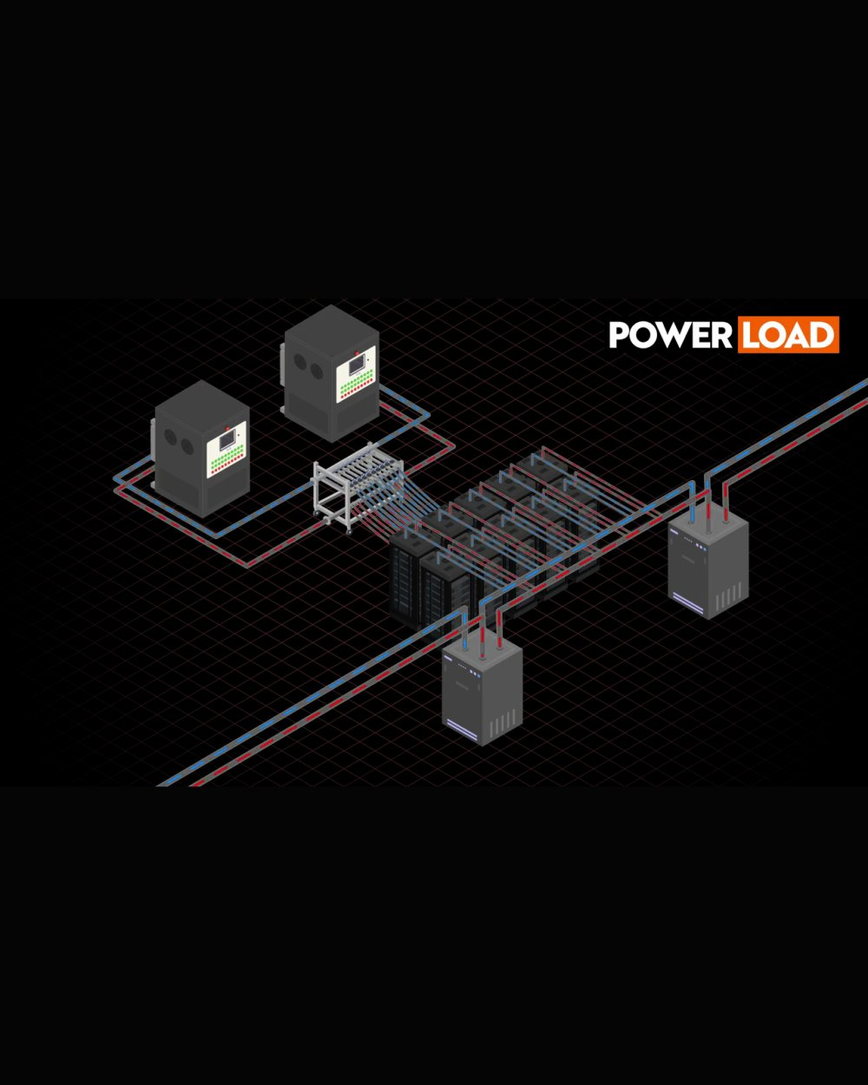
Each outlet is a 1 to 2 inch hose pair with its own metering and control, all running from a single connection to the secondary fluid network.
Individual connections spread control and measurement around the hall, so balancing is manual and readings are taken at different times. A manifold trolley brings flow, pressure and temperature for every circuit into one place, where they can be compared and adjusted together.
Yes. Per-circuit isolation and quick-connect fittings mean the system can be configured or rebalanced without shutting the whole setup down.
Because circuits that perform correctly on their own can still interact when they all draw simultaneously. Testing circuits together is what reveals starvation and imbalance between them.
Where to next

Related reading

Want loop-by-loop evidence?

We will show you the data a monitored manifold gives you and what it catches.